Reports → Signal Analysis
This report shows a summary of how, and which, signals were marked collectively during all sales conversations. It can be filtered, sorted, and downloadedas required.
It consists of three sections -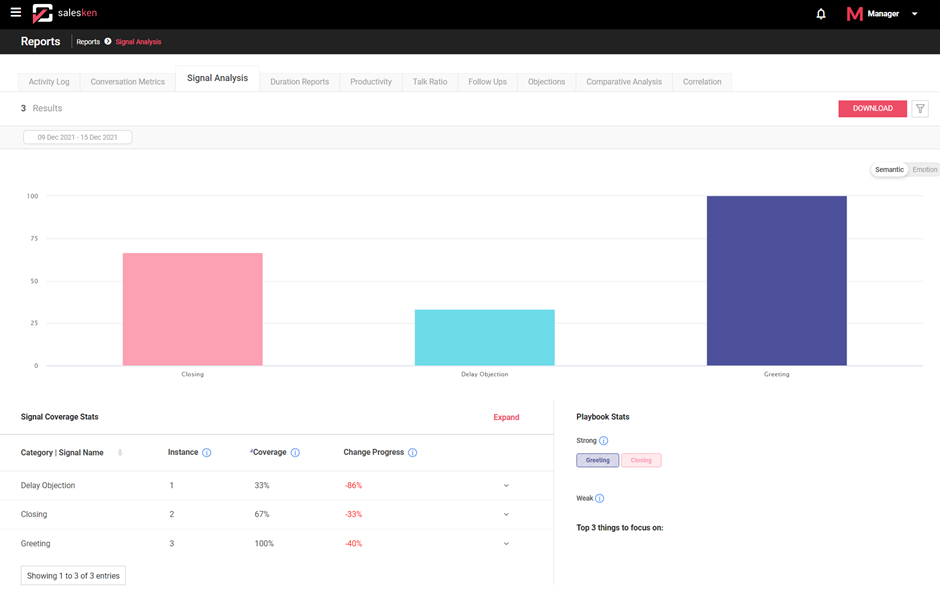
1 → This section is a graph that shows the percentage of occurrence of each signal during all the sales conversations. Hover over each signal to view the exact percentage. This graph can be switched between showing semantic signals vs emotion signals by toggling the switch at the top right corner.
2 → The ‘Signal Coverage Stats’ section shows the signal level statistics. It shows -
- Instances - The number of times the signal was observed across all sales conversations.
- Coverage - The percentage of the analyzed conversations where the signal appeared at least once.
- Change progress - The percentage of increase or decrease in signal observed as compared to the previous week.
To view the coverage details for each tracker associated with the signals, click on ‘Expand’ at the top right corner of this section.

3 → The ‘Playbook Stats’ section classifies signals as ‘strong’ and ‘weak’ based on each signal’s coverage during conversations.
A strong signal is one that appeared in more than 50% of the sales conversations i.e., Coverage >= 50%
A weak signal is one that appeared in less than 20% of the sales conversations i.e., Coverage <= 20%
Filtering
To see what filters are available for this report, click on the funnel filter icon at the top right corner of each report. Select the values you want to filter the report by and click on the ‘Apply’ button.
You can use any of the following filter values or a combination of these:
- Filter by Speaker - Filter by Customer or Agent. Available for signal analysis reports where number of instances of a signal, coverage etc. can be measured from conversations based on what the Rep spoke versus what the customer spoke.
- Filter by Team/Agent - Name of the Team or Agent. Select one of the following:
- Team - to choose a team from the drop-down option.
- Agent - to choose a Rep from the drop-down option.
- Filter by Date Range - Select the 'from' and 'to' date from the calendar. By default, the date range for the filter is set to represent past 7 days.
- Filter by Pipeline- Select the pipeline name from the drop-down. Pipeline is the defined sales process configured under “Configuration” menu. To know more about how to set up pipeline, click here (link the ‘Pipeline -Overview’ page).

Tip - Filters can be reset by clicking on ‘Reset’ link under the filter icon.
Sorting
To sort lists either in ascending or descending order, just click on the titles of each column. Based on the sorting, the values of entire grid will be updated.
Downloading
To download Activity Log report, just click on the ‘DOWNLOAD’ button next to the filter button. The report is downloaded in the Excel (.xlsx) format.